|
|
Doug Johnston, Senior Research Scientist, NCSA, (217) 333-5880
dmj@nsca.uiuc.edu
http://www.gis.uiuc.edu
http://www.ncsa.uiuc.edu/alliance/partners/ApplicationTechnologies/EnvironmentalHydrology.html
Models of geophysical processes (weather, runoff, etc) are developed within focused disciplinary areas, but many environmental events (e.g. flooding) occur through the combined effect of these processes. The Environmental Hydrology Applications Team of the Alliance is prototyping tools to provide an infrastructure for the coupling of geophysical models. The infrastructure consists of example high performance geophysical codes; grid, time, and flux couplers for inter-model communication, large data I/O exercising the emerging grid, and a rich set of visualization environments for model evaluation and communication.
The demonstration supports aspects of the AT program via demonstration of the tools being developed for aiding researchers in building more complex models requiring high-performance computing and visualization. It also draws on work being undertaken by the ET's via implementation with GLOBUS network computing, PETSc parallel solvers, and the visualization groups.
![]()
The demonstrations include a visualization of the coupling of a parallel mesoscale atmospheric model (MM5) computing precipation values based on moisture, temperature, and other boundary conditions at a regional (sub-continent) scale with a hydrologic (surface runoff) model calculating surface water depth at 100 meter resolution. The applications were run as distributed processes using GLOBUS.
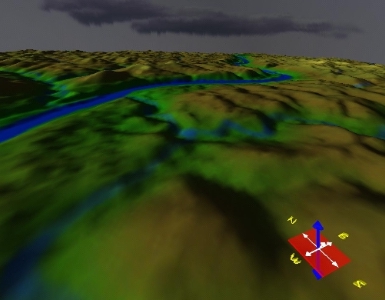
The second application is based on GeoView, a VR application for visualization of landscape processes. This application provides display, navigation, and query functions on model outputs from geographic information systems and simulation models. It is based on OpenGL, SGI Performer, and the Cave and Immersadesk libraries. The demonstration will include visualization of rainfall/runoff events from the same model as used in the previous demonstration.
Output from both demonstrations are 3d immersive views of multi-dimensional time-series data including rainfall depth, runoff depth, flow direction, and particle tracing.
![[Alliance]](http://www.ncsa.uiuc.edu/includes/footer-alliancelogo2.gif)
|
|